Before starting this section, make sure you’ve completed all tasks in the Preparation page and completed lesson 1: Intro to GIS and lesson 2: Mapping our data.
Lesson 3: Publishing a webmap
In this lesson, you will learn how to create and publish a webmap using QGIS and GitHub! This process will come in handy if you ever want to share your work as interactive web maps. There are two parts of this process:
- Use QGIS to export your map to a webmap
- Use GitHub to create a website that will host your files.
Task 0: Get ready
- Make sure that you have your project from the last lesson open.
- Also make sure you have installed the qgis2web plugin for QGIS (instructions).
Task 1: Create a webmap
- With your previous project open, click the Create web map button (also available from the top menu:
Web > qgis2web > Create web map. - When the Export to web map dialog box appears, experiment with the many settings and observe changes in the preview pane.
- For example, experiment with the
Clusterfunction and thePopup fieldsfunctions. Make sure to click Update preview each time to see the effect of the changes.
- For example, experiment with the
- In the Export tab, select
Export to folderand point it to the working folder that contains the rest of your files. - At the bottom of the dialog box, select to save your map to a Leaflet map and click Export.
- This should open up a version of the webmap in your browser. NOTE that this is map not publicly accessible – it is just a file on your computer and is not published to the web.
Task 2 (optional): Create a GitHub Repository | Publish your webmap
In this last (and completely optional) section, you can publish your webmap to the web using GitHub Pages. GitHub is a free-to-use platform that lets people track changes on projects, collaborate with others, and share their contents with others. While it is used heavily for managing software development projects, it is also used to host data, books, and websites. While GitHub is free-to-use, you need to create an account to use it. For this reason, the following exercise is considered optional.
- Create an account (if you don’t already have one) and login to GitHub.
-
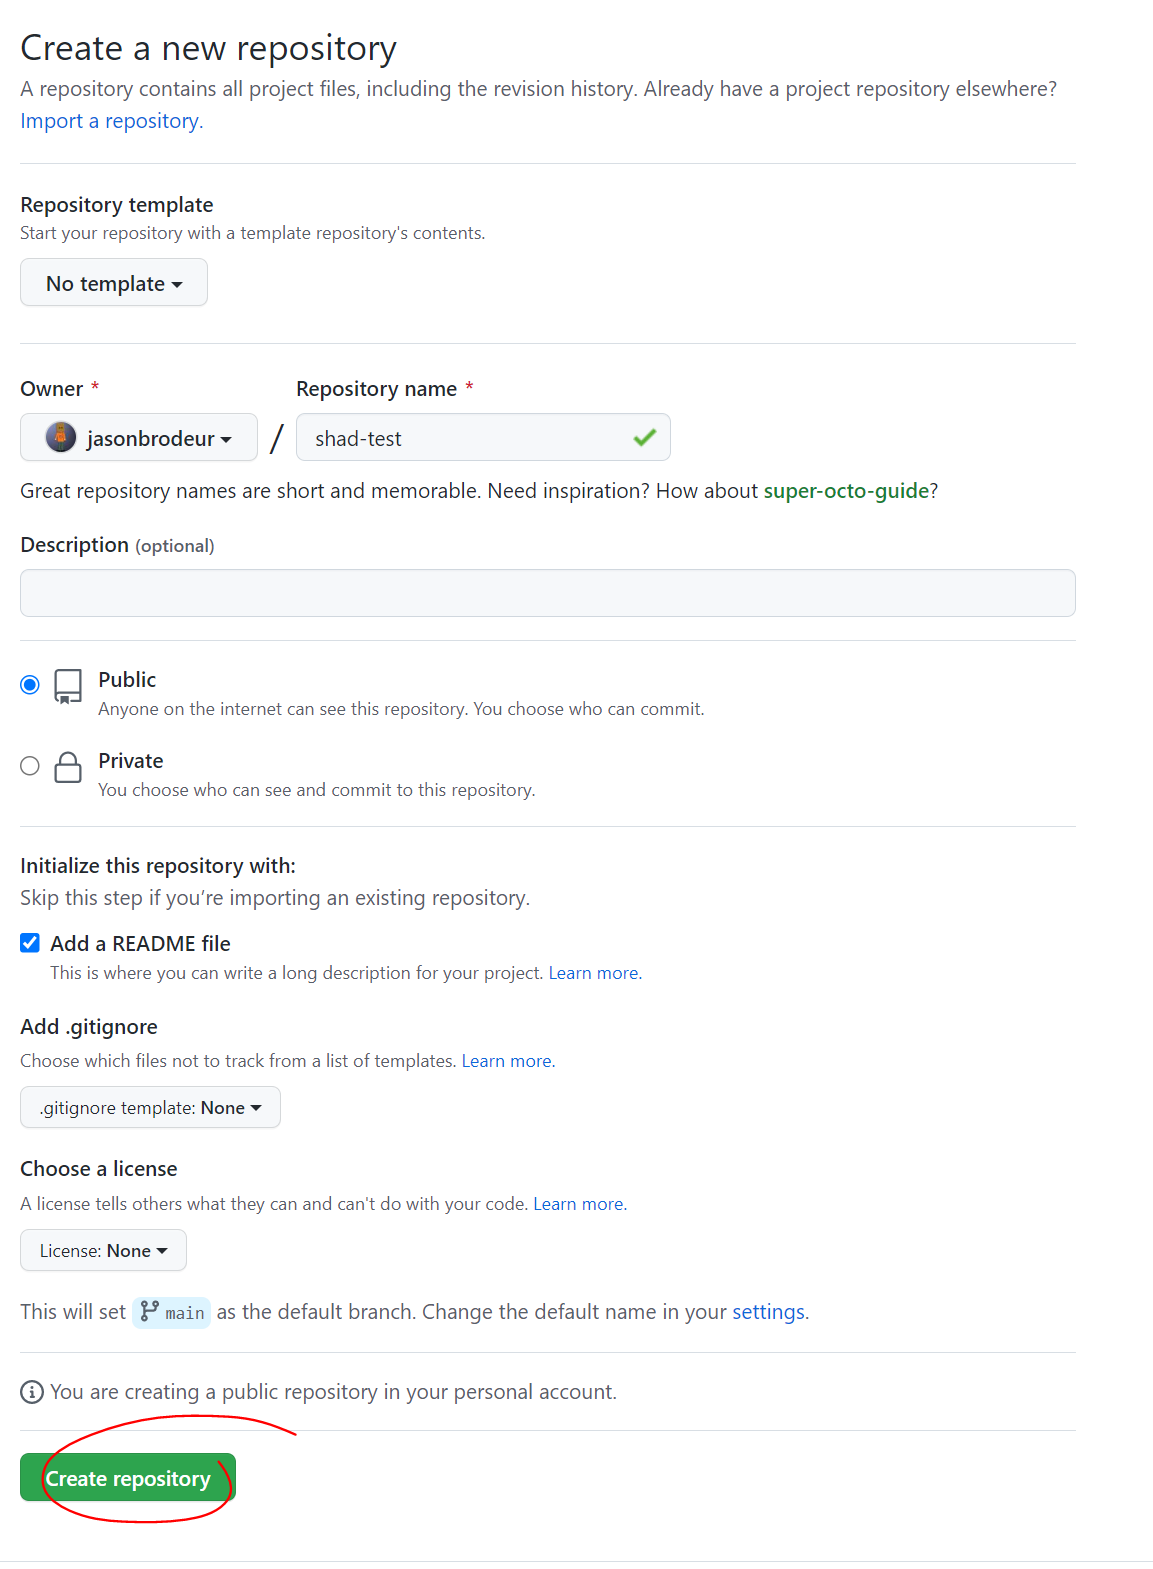
Create a new repository. Add a readme file. Set the privacy to public.
- Upload your webmap files to the repository
- Click on the
<> Codetab at the top of the new GitHub repository. - Click
Add file > Upload files - Drag the contents of your leaflet folder (i.e. everything inside of /qgis2web_2025_07_09/ that was created in part 1 of this exercise) to the upload window.
- Once the files have finished loading, scroll to the bottom and click Commit changes.
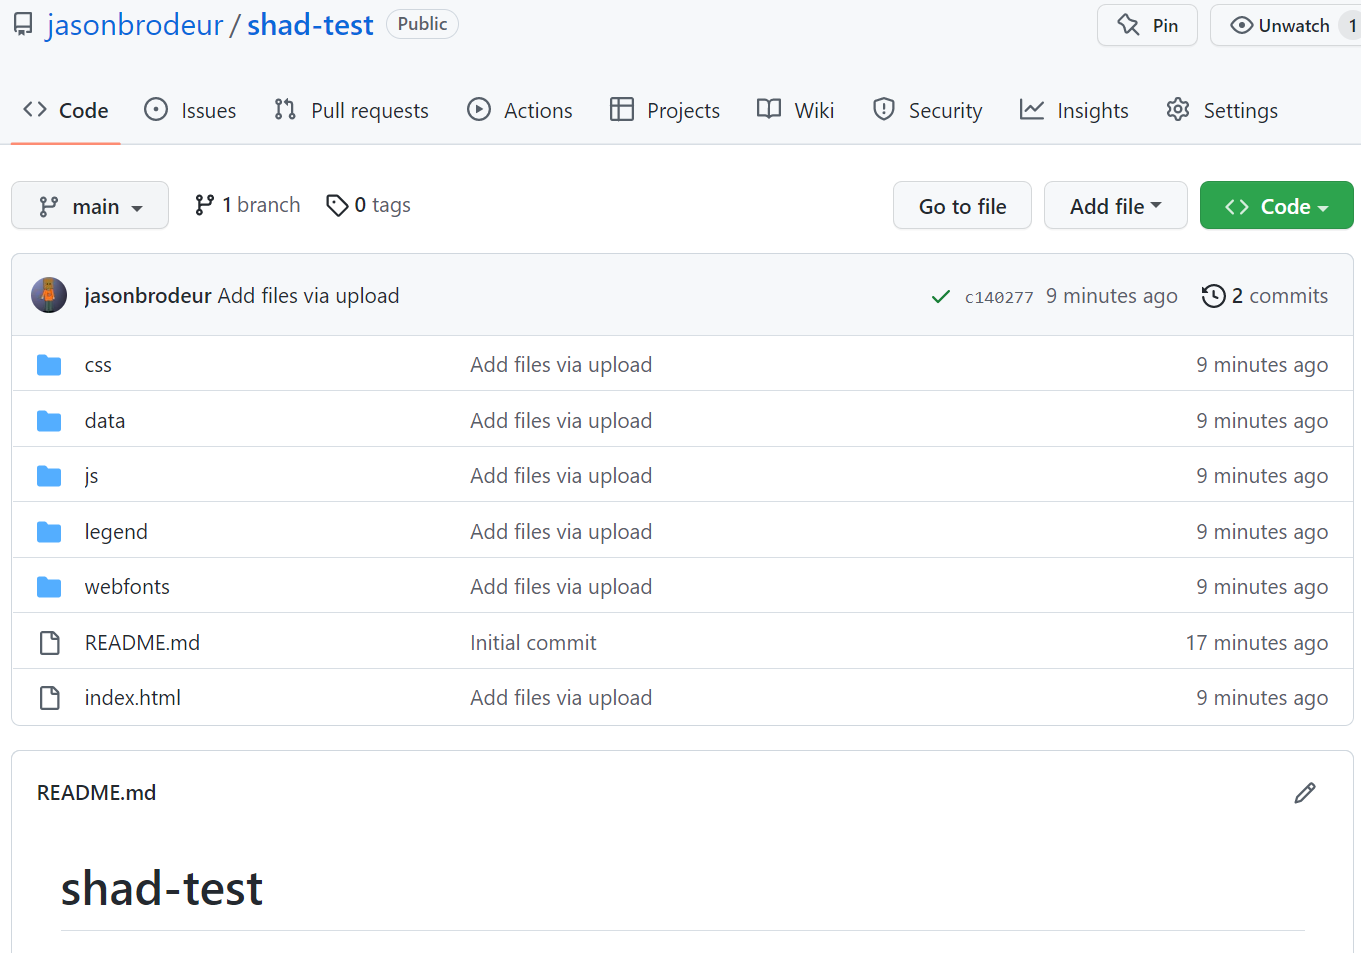
- You should see your files in your repository as follows:
- Click on the
- Turn your repository into a webpage:
- At the repository main page, go to the
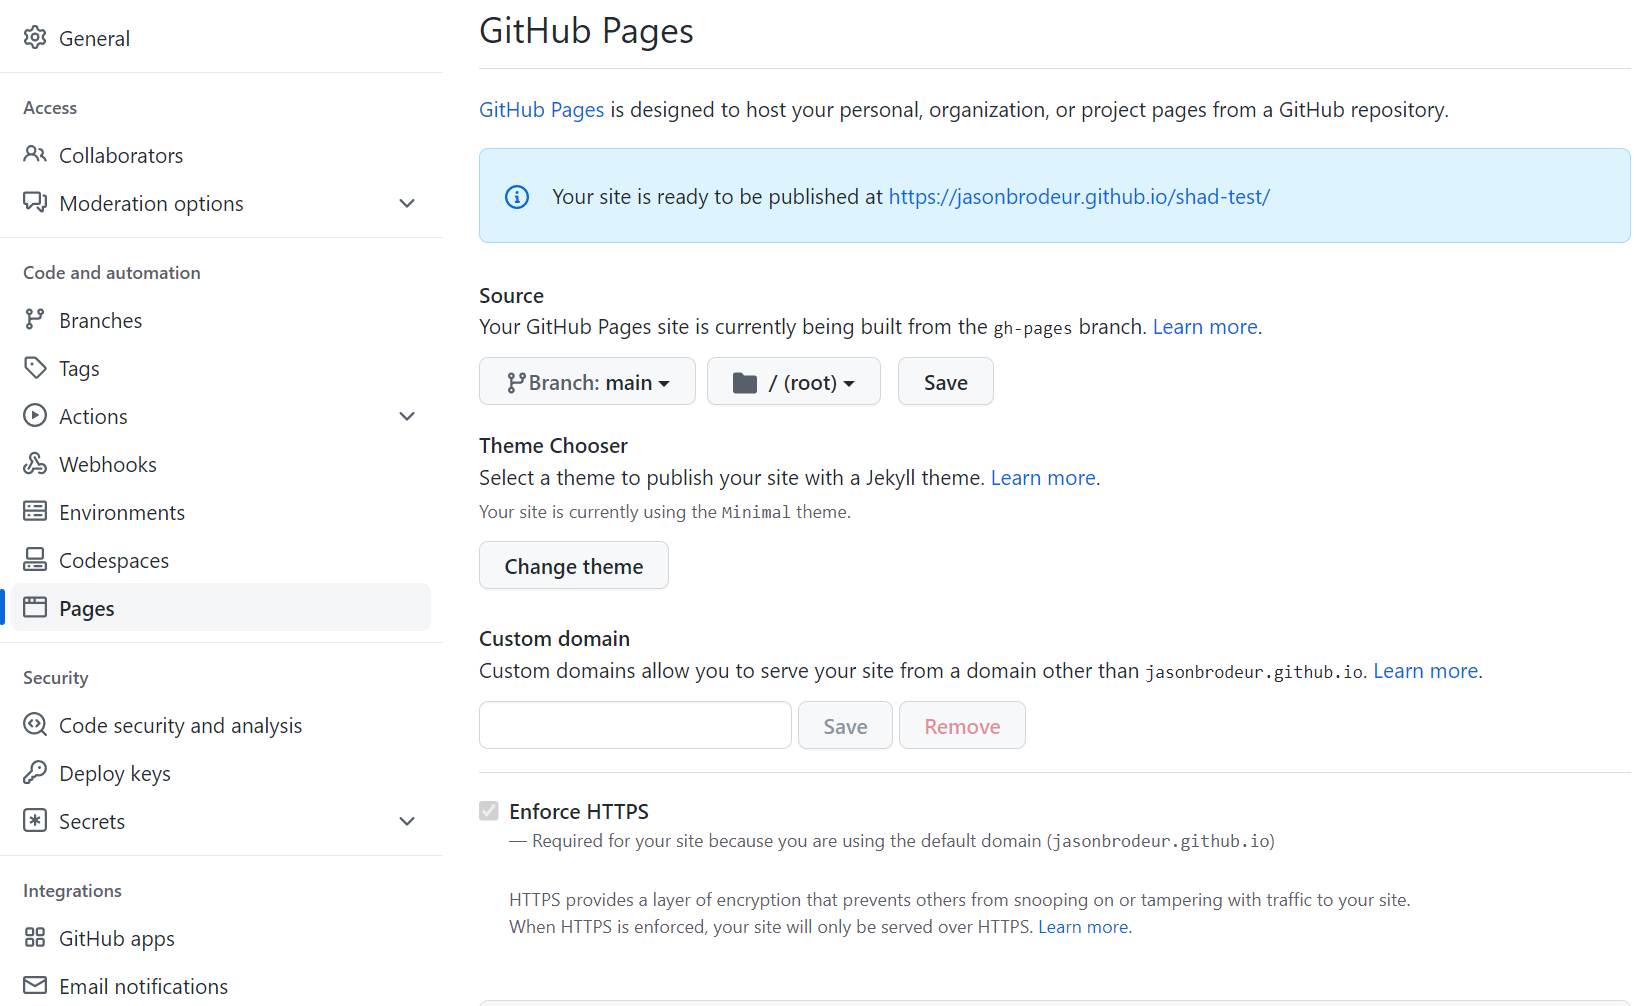
Settingstab and then open thePagespane. - Set
Branch:mainand use/ (root). Click “Save”. - Make a note of the url for your new website.
- Click on the new url to open it in a new window. NOTE: it will take a few minutes for your website to be ready–you’ll need to refresh a few times.
- At the repository main page, go to the
That’s it!!! There is a lot more to learn about and experiment with, of course. Hopefully, these lessons give you an initial sense of the ways in which GIS software can be used to show geospatial characteristics and relationships.